
With logging frameworks like defmt, "printf debugging" is a powerful and easily accessible tool to figure out why your code is behaving differently than expected.
However, sometimes you might still want to use a debugger like gdb, for example if you're spelunking through an unknown codebase or you don't quite know yet what to look for.
This post explains how you can have both at the same time.
probe-run sits at the core of the knurling tooling.
It lets you cargo run programs on embedded hardware and prints the device's defmt logs to the console.
probe-run paired with the defmt-test test harness lets you run unit tests on the embedded target via cargo test.
However, probe-run (v0.2.x) doesn't support GDB (more about that at the end of this post) so you cannot debug the programs you cargo run or cargo test.
It has been possible for a long time to debug embedded Rust programs with GDB and,
these days, extensions like cortex-debug (VS code) ease the process of setting up a GDB session and provide a graphical interface to interact with the debugger.
What most people don't know is that it is possible to get defmt logs out of an embedded program while you step through it using GDB.
That's what we'll demonstrate in this blog post.
This post covers the process of setting up debugging for our app-template using an external GDB server program without losing the defmt logs.
As an example, we'll use
- VS Code as our editor and debugger GUI
- OpenOCD as the external GDB server
- the nRF52840 development kit (nRF52840 DK) as the embedded target – the same board we use in our embedded trainings and the knurling sessions.
NOTE: The full source code for the example covered here can be found on GitHub.
app-template configuration
We've configured an app-template to build code for the nRF52840 DK using the recommended setup steps.
The name crate has been set to app.
In addition to that the src/bin folder has been removed and the main application lives in src/main.rs.
Important changes:
- For the best debugging experience, the
profile.devoverride has been removed (commented out) fromCargo.toml1 - For xtask inter-operation, no default compilation target has been set in
.cargo/config.toml2
Let's look into the GDB setup next.
cortex-debug configuration
In VS code, the debugger configuration goes in the .vscode/launch.json file.
The example repository contains said file with two "launch configurations".
The first launch configuration, 'Flash & Debug', specifies how to flash the firmware and set up a GDB server.
We won't explain what the JSON fields mean in this blog post (you can refer to the cortex-debug docs for details) but if you want to adjust that file for different hardware supported by OpenOCD you'll need to adjust lines 15-34
executable, you may need to change:- the target triple (
thumbv7em-none-eabihf) to match the target embedded device - the program/crate name (
app)
- the target triple (
svdFile, if you have a SVD file for your microcontroller set this field to that file- the SVD file must be next to the
.vscodefolder in the root of the repository
- the SVD file must be next to the
gdbPath, only if your system'sgdbdoesn't not support the ARM architecture. In that case, you'll need to specifyarm-none-eabi-gdbormultiarch-gdbhereconfigFiles, specify your probe and microcontroller here- these configuration files are part of the OpenOCD installation (e.g.
/usr/share/openocd/scripts/)
- these configuration files are part of the OpenOCD installation (e.g.
openOCDPreConfigLaunchCommands, if theinterface/XXX.cfginconfigFilesworks with its default settings then comment out this field
Once that file is in place you can start a new debugging session from the VS code menu: 'Run > Start debugging' (shortcut: F5).
This should pick up the 'Flash & Debug' launch configuration; if it doesn't select it from the drop down menu in the 'Run and Debug' sidebar (shortcut: Ctrl+Shift+D).
This launch configuration will flash the microcontroller and run the program until it reaches the main function.
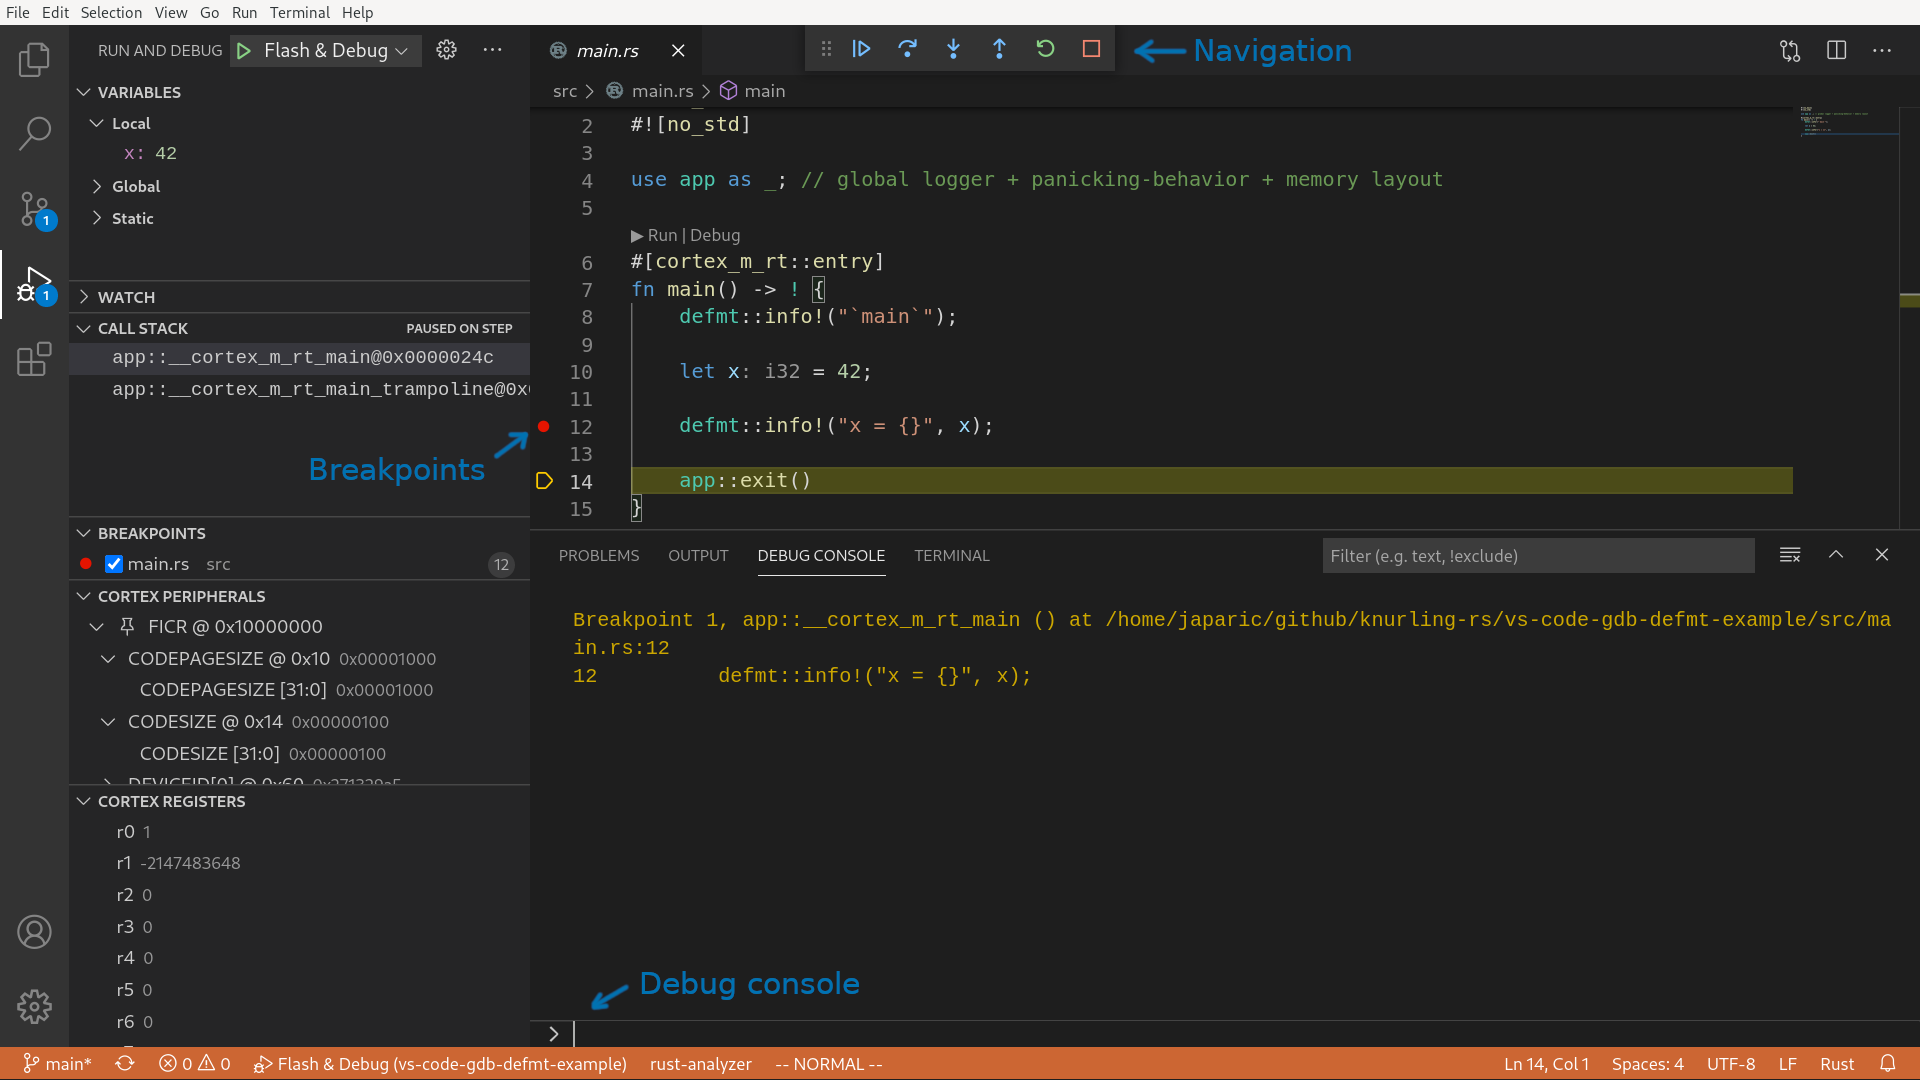
The picture below gives you an overview of cortex-debug debugging interface.
When you start the debugging session the program will be halted at the start of the main function.
There's also a GDB console if you prefer to write GDB commands over the graphical interface.
defmt-print
With that JSON file the debugger is in place but there are no defmt logs yet.
To print those logs you'll need to get the defmt data out of the device, decode it and then print it to the console.
defmt-print, another knurling tool, handles the last 2 steps: it decodes defmt data from standard input and prints the logs to the console, using the same format as probe-run.
To get the RTT (defmt's default transport) data out of the device we can use OpenOCD's RTT support.
Here's how:
NOTE: You'll need a recent OpenOCD; OpenOCD supports RTT only as of version 0.11.0 (March 2021)
- Uncomment lines 19-24 in
.vscode/launch.json
"postLaunchCommands": [
    "monitor rtt server start 8765 0",
    // should span the *right* part of RAM
    "monitor rtt setup 0x2003fbc8 0x30 \"SEGGER RTT\"",
    "monitor rtt start",
],
- Adjust line 22 to point to the location of the RTT control block in RAM
You can get the location of the of the RTT control block with these commands.
NOTE: rust-nm is part of the cargo-binutils crate.
$ cargo build

$ rust-nm -S target/thumbv7*/debug/app | grep RTT
2003fbc8 00000030 D _SEGGER_RTT
_SEGGER_RTT is the name of the RTT control block.
The first column is the location of the control block in hexadecimal format.
The second column is the size of the control block, also in hexadecimal format.
If you enter those two numbers in line 22; it will look like this:
"monitor rtt setup 0x2003fbc8 0x30 \"SEGGER RTT\"",
With that in place, start a new debugging session (with F5).
While the program is halted in main run this command a in VS code terminal:
NOTE: nc is the netcat program, which reads data from a TCP port and prints it to the standard out
$ nc localhost 8765 | defmt-print -e target/thumbv7*/debug/app
That command will block; leaving that terminal running in the background.
Now, as you step through the code using the debugger you'll see defmt logs in the output of the defmt-print command.
This is demonstrated in the intro video.
You are probably curious about having to enter the memory location of the RTT control block in .vscode/launch.json.
Does one need to update that line if the program changes?
The answer is yes.
In theory, specifying the whole RAM in the monitor rtt setup command also works – that would be 0x20000000 262144 for the nRF52840 which has 256 KB of RAM.
That approach has 2 issues however:
- OpenOCD does a linear search on that memory range for the RTT control block. If the block is towards the end of the range, which will be the case if you are using
flip-linkfor stack overflow protection, then that operation can take a noticeable amount of time. - OpenOCD may find and use an old version of the control block; this results in no new logs being printed at best and decoding errors at worst. The whole RAM is not cleared every time a new program is flashed / run so this can occur if the amount of static variables used in the program changes.
Packing it into an xtask
Having to manually update the memory location of the RTT control block is quite inconvenient so let's automate that with an xtask. If you are not familiar with the concept of xtasks: they are a pattern for adding project-specific subcommands to Cargo.
The example repository contains a GDB xtask that roughly executes the following commands.
$ T=thumbv7em-none-eabi
$ B=app

$ cargo build --target $T --bin $B

$ # extract address of RTT control block from
$ rust-nm -C target/$T/debug/$B

$ # use the address in
$ openocd $FLASH_GDB_ARGS &

$ nc localhost 8765 | defmt-print -e target/$T/debug/$B
This xtask flashes the firmware and spawns a GDB server so it can not be used with the 'Flash & Debug' launch configuration from the previous section.
Instead you need to use the other launch configuration provided in the example: 'Attach Debug'.
This second launch configuration spawns a GDB client that connects to an existing GDB server so you need to run cargo xtask gdb first and then launch the 'Attach Debug' configuration.
(The 'Exception has occurred' error message in the video is harmless and can be ignored)
The 'Attach Debug' configuration is in lines 36-47 of .vscode/launch.json.
It has less knobs than the 'Flash & Debug' configuration but you still need to specify the file to the program's ELF.
Is probe-run no longer necessary?
This GDB + defmt-print setup is not replacement for probe-run.
You can still, and in my opinion should, use probe-run in your project.
The example project is configured to use probe-run:
cargo run --bin app will run the app with probe-run and
cargo test -p testsuite will run unit tests on the embedded target with probe-run.
This VS code launch configuration is for when you need a debugger. If you structured your embedded project with testing in mind you may be able to find and fix many issues via testing on the host before you even put code on the embedded target. That way the debugger is left for those tricky cases where the hardware is not doing what it's supposed to be doing due to e.g. silicon bugs or bugs in the Hardware Abstraction Layer (HAL). Also, sometimes it's easier to step through third party code that has no logs with GDB than it's to source patch it to add logging functionality.
Using alternative defmt transport and GDB server protocols
In the above example, we used OpenOCD as the debug server and RTT as the defmt transport protocol but this approach can be used with other GDB servers and transport protocols.
Because the GDB server is started from an xtask and not from cortex-debug you can use any third party GDB server.
defmt-print decodes data from standard input so as long as you can pipe the defmt data into it you can use any transport protocol.
For example, you could send the defmt data over a (virtual) serial port if your version of OpenOCD doesn't support RTT.
On unix systems, serial ports appear as files under the /dev/.
To print the defmt logs you can invoke this command from the xtask:
$ cat /dev/ttyUSB0 | defmt-print -f path/to/elf
Conclusion
We have demonstrated how to add GDB support to the knurling app-template.
The advantages of this setup over the stock app-template are:
- GDB support and
defmtlogs - OpenOCD has faster flashing speed 3.
The disadvantages are:
- You need an external GDB server program like OpenOCD
- It requires quite a bit of initial configuration, which is not straightforward to put together
GDB in probe-run
We'd love to provide a GDB server with probe-run.
That would make debugging as simple as passing a --gdb flag to probe-run (e.g. in .cargo/config.toml) to start the GDB server.
Then attaching a GDB client could be done with the 'Attach Debug' launch configuration in VS code or directly with the gdb program.
GDB functionality is already available in probe-rs, the library that probe-run uses for flashing and other probe related operations, but as of v0.10.1 probe-rs doesn't support a GDB server and RTT data transfers running concurrently.
RTT is the defmt transport protocol used in probe-run; for that reason we don't expose GDB support in probe-run.
Concurrent operation of GDB and RTT is available in the git version of probe-rs so we are looking forward to integrate that into probe-run when that's available on crates.io.
In our experience, the GDB server implementation in probe-rs is not quite as mature as OpenOCD: for example, breakpoints work but stepping operations do not work reliably.
We'd love to see great GDB support in probe-rs as well as better performance for the flashing operation.
To make that happen you can fund the probe-rs project via GitHub sponsors and/or contribute to the project on GitHub.
-
The
app-templateis configured to optimizeddevbuilds for size: this results in smaller binaries and short flashing times. However, optimizations degrade the debuggability of a program so you want the default of zero optimizations. ↩ -
The other option is to follow the directory structure from this blog post and put the code that will be cross compiled into its own folder ↩
-
In our testing, OpenOCD flashed the firmware at 25.9 KiB/s;
probe-run(probe-rs), at 11 KiB/s. This was with a J-Link probe; results may be different with other probes. ↩


