
Since the releases of defmt and probe-run there have been many improvements in the defmt ecosystem and work on new tools.
We have been posting those updates on Twitter but in case you missed them this blog post is a summary of those updates.
Location information
Log messages now include the location of the log statement. The location is presented as:
- the path to the function that contains the log statement, e.g.
some_crate::some_module::some_function - the file path and line number of the log statement, e.g.
src/module.rs:12.
fn main() -> ! {
    defmt::info!("main");
    lpc_app::hal::init();

    defmt::info!("exiting ..");
    lpc_app::exit()
}
$ cargo run --bin hello
0.000000 INFO  main
└─ hello::__cortex_m_rt_main @ src/bin/hello.rs:8
0.000001 INFO  HAL has been initialized
└─ lpc_app::hal::init @ src/hal.rs:3
0.000002 INFO  exiting ..
└─ hello::__cortex_m_rt_main @ src/bin/hello.rs:11
(..)
The syntax used for this information is understood by VS code and can be clicked to navigate to the log statement.
Navigating to the location of a log statement in VS Code
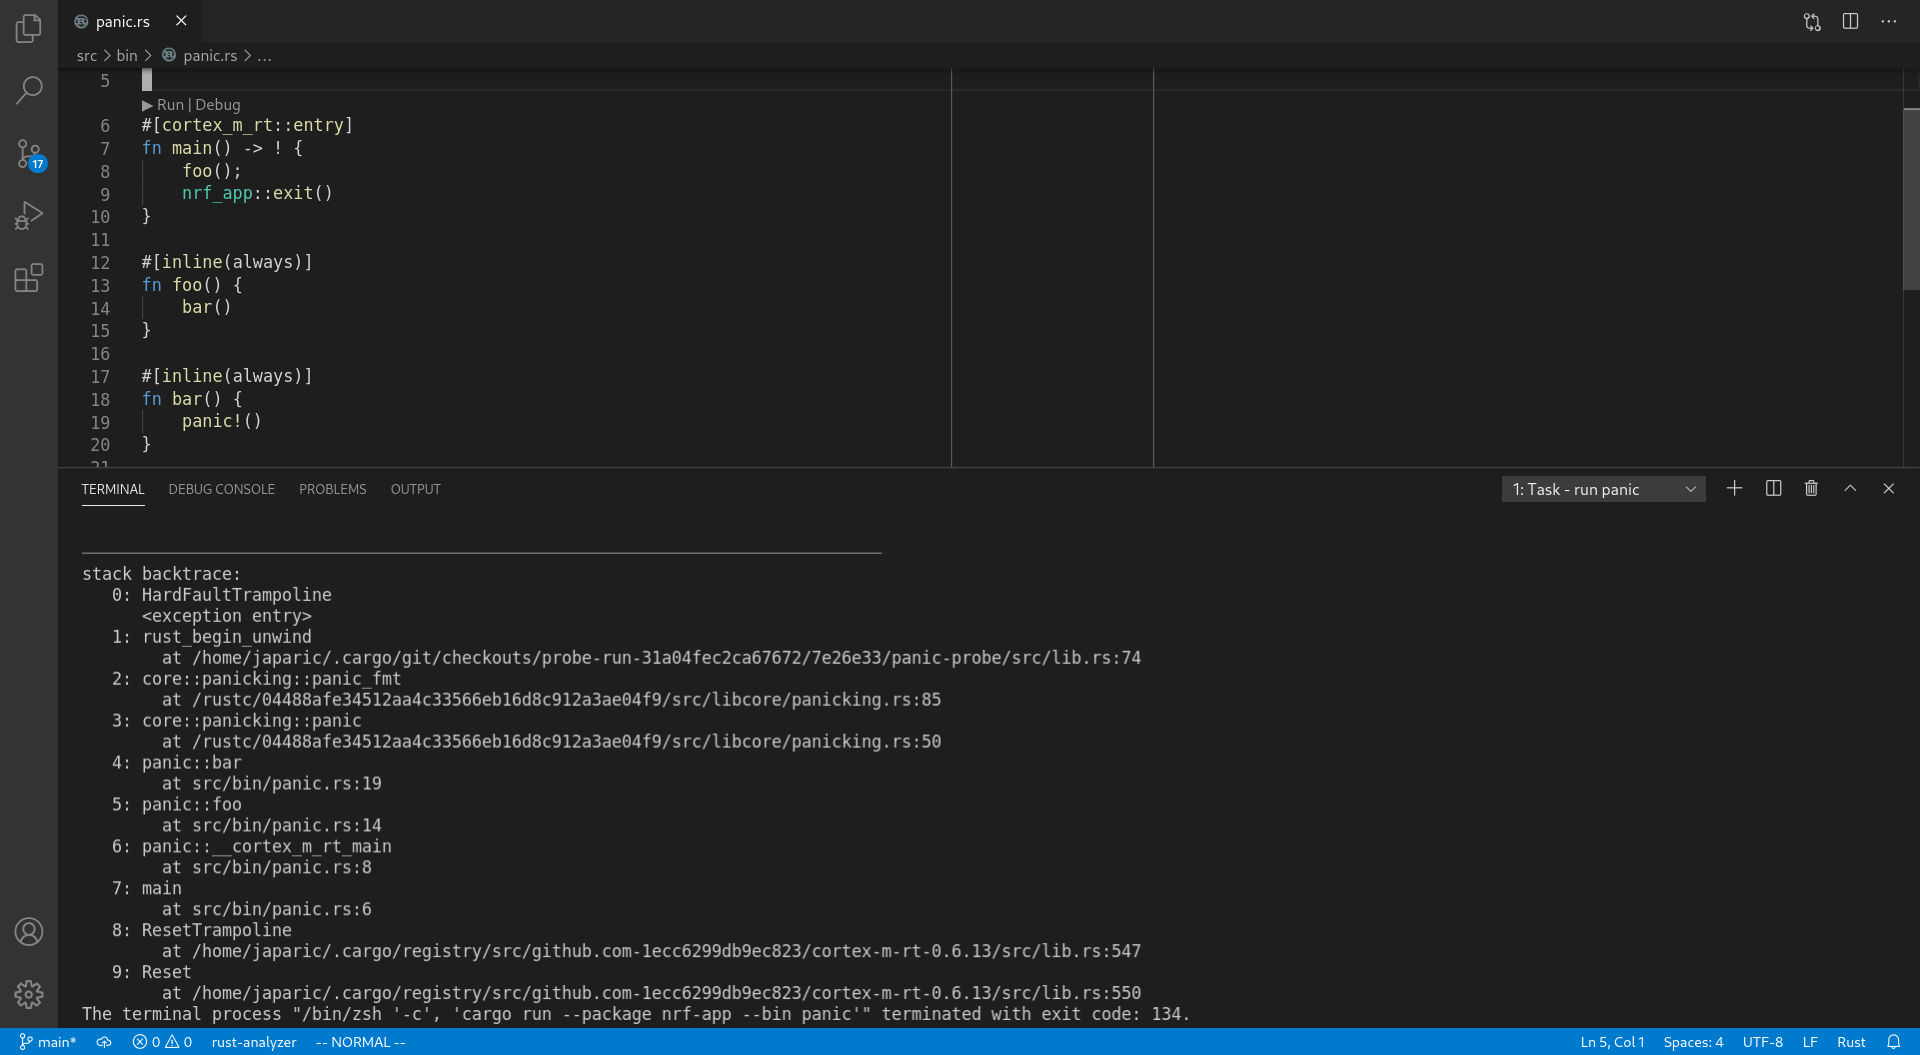
Improved backtraces
Backtraces now include inlined functions – they'll appear as extra frames – as well as location information.
// src/bin/panic.rs
fn main() -> ! {
    foo();
    nrf_app::exit()
}

#[inline(always)]
fn foo() {
    bar()
}

#[inline(always)]
fn bar() {
    panic!()
}
stack backtrace:
   0: HardFaultTrampoline
      <exception entry>
   1: rust_begin_unwind
        at (..)/panic-probe/src/lib.rs:74
   2: core::panicking::panic_fmt
        at (..)/src/libcore/panicking.rs:85
   3: core::panicking::panic
        at (..)/src/libcore/panicking.rs:50
   4: panic::bar
        at src/bin/panic.rs:19
   5: panic::foo
        at src/bin/panic.rs:14
   6: panic::__cortex_m_rt_main
        at src/bin/panic.rs:8
   7: main
        at src/bin/panic.rs:6
   8: ResetTrampoline
        at (..)/cortex-m-rt-0.6.13/src/lib.rs:547
   9: Reset
        at (..)/cortex-m-rt-0.6.13/src/lib.rs:550
Probe selection
You can specify which probe probe-run will use via the --probe flag.
The flag takes an argument of the form $vendor_id:$product_id:[$serial_number].
This flag is particularly useful if you have more that one development board connected to your PC / laptop.
Some examples:
--probe 1fc9:0132will use the probe that identifies itself as a USB device with a vendor ID of0x1fc9and product ID of0x0132--probe 1fc9:0132:0F01502Cwill use the probe that identifies itself as a USB device with a vendor ID of0x1fc9, product ID of0x0132and a serial number of0F01502C
To dedicate a whole Cargo project to a particular development board you can specify the flag in .cargo/config.toml
# .cargo/config.toml
runner = "probe-run --chip LPC845 --probe 1fc9:0132:0F01502C --defmt"
On the other hand, if you want to run programs within the same Cargo project on different boards you can use the PROBE_RUN_PROBE environment variable.
$ # terminal 1 - runs on device #1
$ PROBE_RUN_PROBE=1fc9:0132:0F01502C cargo run --bin my-app
$ # terminal 2 (same directory) - runs on device #2
$ PROBE_RUN_PROBE=1fc9:0132:502C0F01 cargo run --bin my-app
Stack overflow protection
We have built a linker wrapper, flip-link, that adds zero cost stack overflow protection to your embedded program.
Function calls and local (stack) variables inside those functions use stack space. Embedded devices have limited amount of RAM allocated for the (function call) stack. When a large number of functions are invoked in a nested fashion (recursive functions are particularly problematic) the stack can overflow its allocated space.
Unless a hardware mechanism like the Memory Protection Unit (MPU) has been configured to catch stack overflows most ARM Cortex-M programs will corrupt their own memory when the call stack overflows. ARM Cortex-M0 devices don't ship with a MPU so that kind of stack overflow protection is not possible on those devices. Another approach to stack overflow protection are stack probes but this requires LLVM support; currently only non-bare-metal x86 targets have stack probe support.
The approach used by flip-link consists of flipping the standard memory layout of ARM Cortex-M programs.
With this inverted memory layout, the stack hits the boundary of the RAM region when it "overflows" instead of corrupting memory.
This boundary collision raises a hardware exception (usually the "hard fault" exception), which by default halts the program.
Embedded programs loaded by probe-run will make probe-run exit with non-zero exit code on stack overflows.
Running a program that overflows its stack with and without stack overflow protection. Without protection the program corrupts its memory; resulting in some log messages being lost.
Stack overflow detection
Even if you don't use flip-link, probe-run can still detect stack overflows.
probe-run reports potential stack overflows as warnings and certain stack overflows as errors.
The warning mechanism is implemented by filling a small unused section of RAM that's farthest away from the start stack with a known bit pattern. When the program finishes this section is checked; if it was modified then the program used "too much stack space"; this is reported as a potential stack overflow.
The 'certain detection' mechanism checks the value of the Stack Pointer (SP) when the program exits abnormally (reaches the hard fault exception).
If its value is outside an acceptable range, e.g. inside the .bss or .data section or outside the RAM region, then a stack overflow error is reported.
Note that in both cases if flip-link is not used then probe-run will report the stack overflow after memory has been corrupted.
Unit testing
We demoed using cargo test to run tests on an embedded device in a previous blog post.
Since then we have created a procedural macro called defmt-test* to make writing unit tests more ergonomic.
*defmt-test is currently in preview state and only available to our GitHub sponsors
With this proc-macro you can write unit tests as if you were using the built-in #[test] attribute.
// testsuite/tests/test.rs

#[defmt_test::tests]
mod tests {
    #[test]
    fn assert_true() {
        assert!(true)
    }

    #[test]
    fn assert_false() {
        assert!(false)
    }
}
$ cargo test -p testsuite
0.000000 INFO  running assert_true ..
0.000001 INFO  .. assert_true ok
0.000002 INFO  running assert_false ..
0.000003 ERROR panicked at 'assertion failed: false', tests/test.rs:15:9
stack backtrace:
(..)
error: test failed, to rerun pass `-p testsuite --test all`

$ echo $?
134
With this proc-macro you can also specify some initialization (#[init]) code that will run before the unit tests.
The value returned by the #[init] will be shared by the unit tests.
You can use #[init] to initialize the target device peripherals.
#[defmt_test::tests]
mod tests {
    // TMP = some I2C temperature sensor
    #[init]
    fn init() -> tmp::Tmp {
        let i2c = hal::I2c::init();
        tmp::Tmp::new(i2c)
    }

    #[test]
    fn check_deviceid_register(tmp: &mut tmp::Tmp) {
        assert_eq!(tmp.read_deviceid_register(), tmp::DEVICEID);
    }

    #[test]
    fn reasonable_temperature(tmp: &mut tmp::Tmp) {
        const MIN: i8 = 10;
        const MAX: i8 = 40;
        let temp = tmp.read_temperature();
        assert!(temp >= MIN, "too cold");
        assert!(temp <= MAX, "too hot");
    }
}
Sponsor this work
probe-run and panic-probe are Knurling projects and can be funded through GitHub
sponsors. Sponsors get early access to the tools we are building. Thank
you to all of the people already sponsoring our work through the Knurling project!


