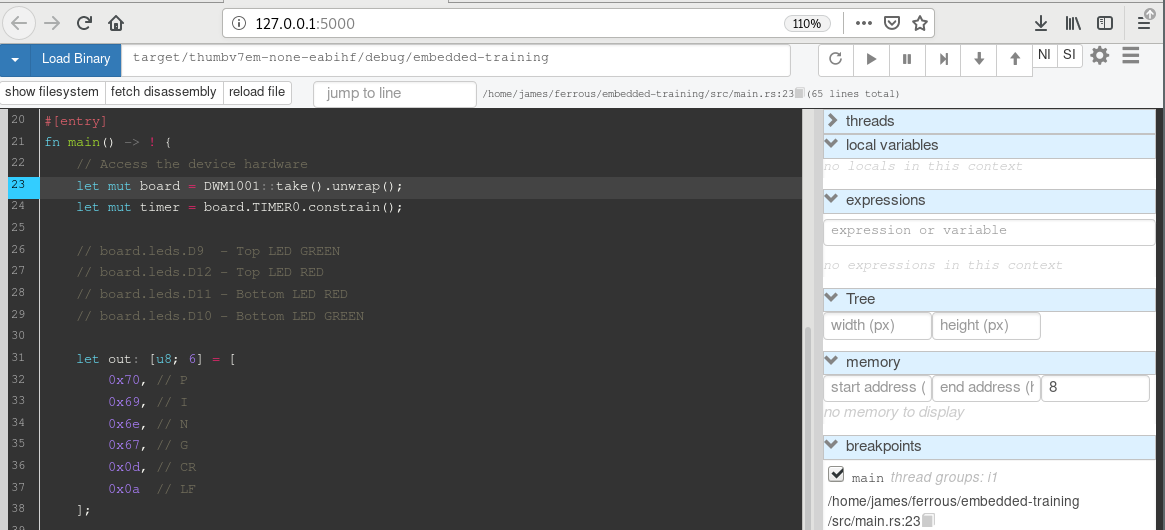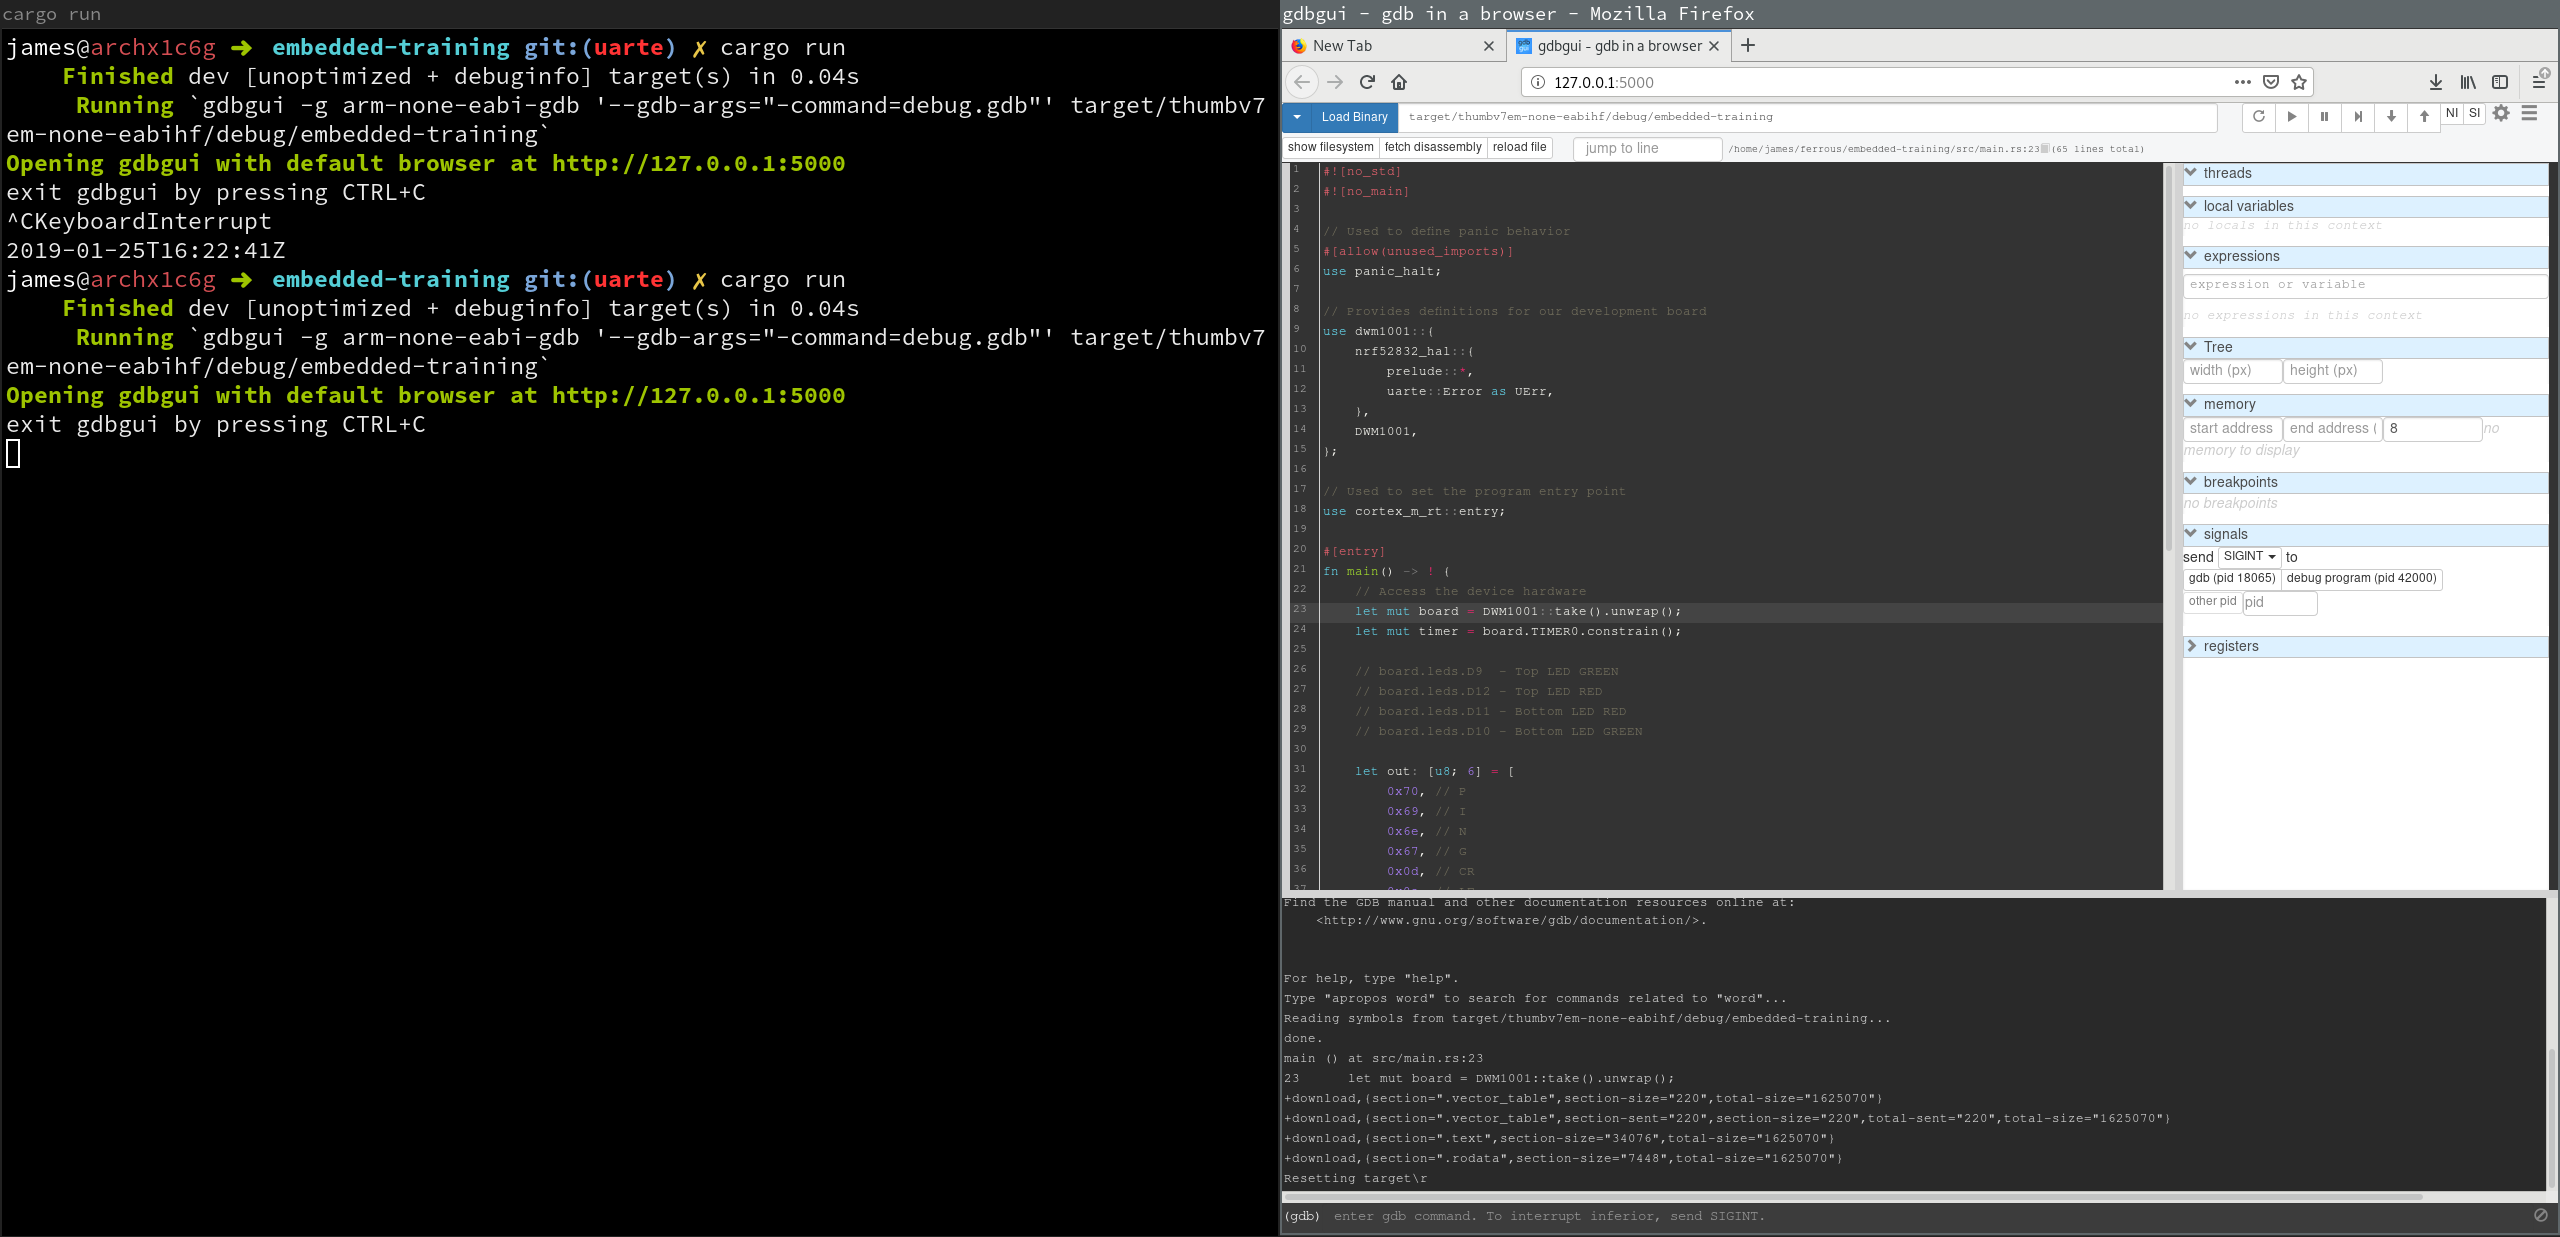
So, I recently re-discovered gdbgui - a python tool that attaches to a GDB server and provides a graphical frontend in your browser. It turns out, this works really well for Embedded Rust Development! This also works across Windows, Mac, and Linux, which means it should be handy for most embedded devs out there!
I noticed a couple small tweaks that were necessary to get this working for me, and I wanted to share. Here are my suggestions for getting started:
1. Install
Check out their installation instructions. In addition, you will also need:
arm-none-eabi-gdb, and it will need to be in your path. See the embedded book for platform specific installation instructions- Some kind of embedded GDB server, such as
openocd, Black Magic Probe, orJlinkGDBServer. If you have already been debugging non-graphically, you're already good to go. You'll need to separately start this server before proceeding!
2. Tweak your project
To launch the debugger when you type cargo run at the command line, you'll need to do two things:
2.1 Setup a Batch Command File
There are a couple gdb commands you'll want to run every time you start debugging. These can be automated by adding a debug.gdb file to your folder, which we will invoke at the command line using gdb's -command argument.
The contents of this file should look something like this:
# This connects to the GDB server running locally.
#   - for openocd, use port :3333
#   - for JLinkGDBServer, use port :2331
target remote :2331

# Due to https://github.com/rust-embedded/cortex-m-rt/issues/139,
#   we will get an infinite backtrace on a panic!(). Set a finite
#   limit to the backtrace to prevent the debugger falling into
#   an endless loop trying to read the backtrace
set backtrace limit 32

# Load the specified firmware onto the device
load

# Reset the target device before running (using JLinkGDBServer)
monitor reset

# Reset the target device before running (using openocd)
# monitor reset halt

# Begin running the program
continue
This file should be placed at the root of your project, or wherever you execute cargo run from.
2.2 Setup a Cargo Runner Command
We can customize the action of cargo run by modifying .cargo/config. You probably already have a .cargo/config file if you are working on an embedded rust project.
You'll want to have a .cargo/config file that contains something like this:
[target.thumbv7em-none-eabihf]
runner = 'gdbgui -g arm-none-eabi-gdb --gdb-args="-command=debug.gdb"'
NOTE: For this to work, both gdbgui and arm-none-eabi-gdb must be installed, and in your path.
Breaking down the items here:
runner = ...- this sets the command that is executed uponcargo rungdbgui- this is the executable-g arm-none-eabi-gdb- this tells gdbgui to use the embedded gdb, instead of the regularly installedgdb--gdb-args=""- these flags are passed toarm-none-eabi-gdb, notgdbgui- NOTE: Cargo's string quoting does not play nicely with nested quotes. I was unable to get more than one argument into this string, but this was enough for me.
-command=debug.gdb- this tellsarm-none-eabi-gdbto execute thedebug.gdbfile before anything else
NOTE: If your platform's Cortex GDB is gdb-multiarch, that works as well – your runner line will look something like this:
runner = 'gdbgui --gdb-args="-command=debug.gdb"'
Debug!
You should now be able to debug by just running cargo run at the command line.

By default, gdbgui will place a breakpoint at the top of main, so our debug.gdb will load the code, begin running, then halt at the top of main. This setting can be disabled in the gdbgui settings.
When you are done debugging, you can close the tab, and hit Ctrl-C on the cargo run console to close the server.
In general, things should work similarly to regular gdb or gdb -tui. Some differences I've noticed:
- Just hitting enter on the console doesn't repeat the command. You need to hit "up", then "enter" to repeat an old command
- You can't hit
Ctrl-Cto break running code. In the window panel to the right, there is aSignalstab, and you need to sendSIGINTtogdb (pid xxxxx). This will break the running program.


